Measuring the Mobile Experience
I gave a talk called “Measuring the Mobile Experience: The Analytics of Handheld UX” in San Francisco. Many thanks to the organizers of HTML5DevConf for letting me be a part of their technical conference.
My main message is this: if your app isn’t using analytics to record interactions with the user interface then you have no idea how your customers are experiencing your web and native apps. Track those events!
Fact-Based Decisions
When you add analytics into your webpage, webapp, and native app you empower your entire team to make fact-based decisions to better enable your customers to use your technology.
I choose Google Analytics because it’s an industry leader and relatively easy to integrate. Their free tier is powerful and helps you learn. Learn what? Learn that features you build into your software are returning value on their investment of time and talent.
Analytics information will come in 2 manners: active, and passive.
Passive Analytics
Passive analytics data automatically collects information about your users. Their hardware, their browser, operating system, and location in the world. You basically get this for free by simply linking the analytics system into your app.
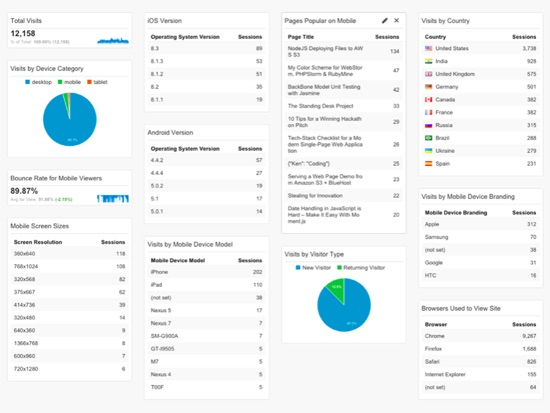
Quickly discover the actionable insights that you can choose to act upon:
- Operating system and version number: engineers decide when to support new system features.
- Device and brand name: testers decide what handheld hardware to buy for compatibility assurance.
- Screen resolution: designers decide at what sizes they lay out UI and create art assets.
Active Analytics
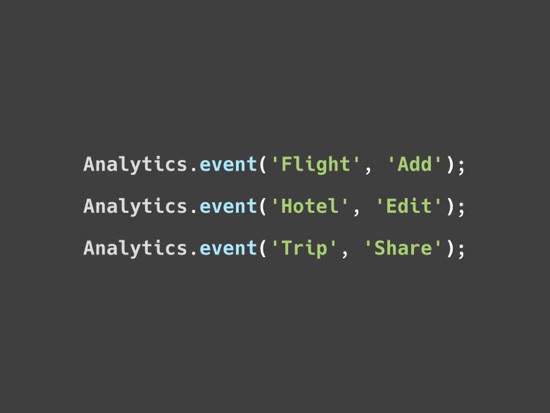
Active analytics tracking is done by adding simple lines of JavaScript code when parts of your user interface are touched. Begin with a few of your app’s workflows. Add more tracking event code if it becomes a valuable part of your culture.
I recommend that you keep event tracking data simple. Imagine object -> action. Think of a major category of objects and things: trips, documents, music, deserts. Then consider the minor actions that are done on them: share, create, search, buy.
Write a simple code module that lets your app developers write track events inline with the existing and new business logic. It’s a facade pattern to hide away details of working with the analytics system.
It delivers 2 great benefits to you development team:
- Easy to understand and quicker to code dozens of events through your UI.
- Safer to switch the underlying analytics library if a change becomes interesting.
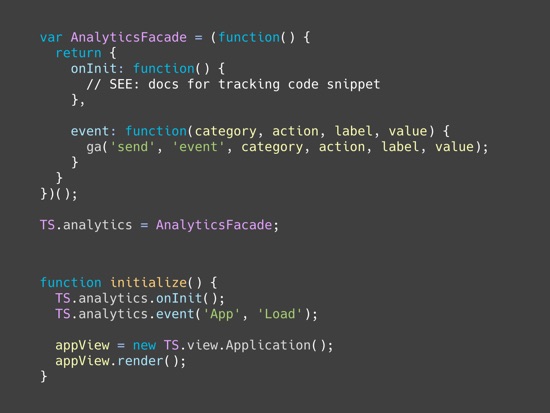
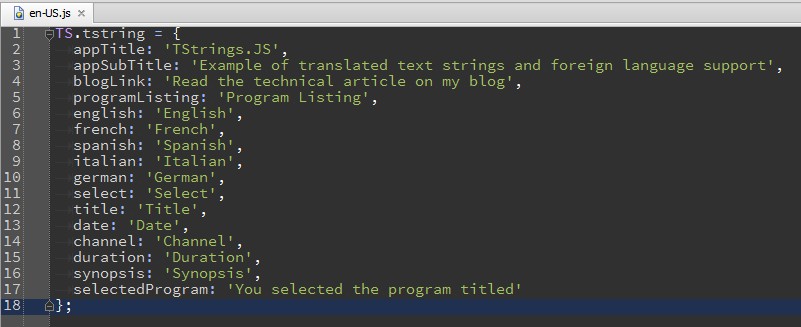
Please read the source code in my TStringJS demo project to see a working example of analytics track-event.
Architect this well and make it easy to code analytics in your webapp. Keeping it simple, functional, and reliable means programmers will use the feature more often. Developer happiness leads to more data details that you and everyone on your team will use for concrete decision making.
Data-Driven Organizations
More data allows your organization to become data-driven. Don’t guess. Allow reports on trends to influence your discussions.
Report often and to everyone. Have a transparent organization that entrusts all people in every role to make good choices.
Create reports that cut through big data overload. Let the numbers tell you how new features are performing against key indicators.
Celebrate when features are delivering business value. Invest time and talent to improve, or remove, underperforming features.
Mistakes aren’t failures when you learn from them. Embrace change and allow yourself to quickly adapt.
Discover the Trends
Measure your user experience and visualize the numbers as reports. Discover the trends. Imagine these are your users talking to you. Listen well because they’re telling you what they do, can’t do, and want to do.
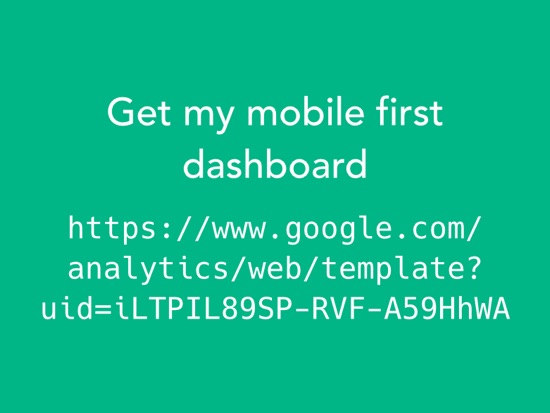
Let me add value into your life now. I’ve shared my prized mobile-first reporting dashboard. You saw a picture of it above. A shared link to my dashboard is shown in the slide above. Paste that URL into your browser and Google Analytics will confirm that you want to apply my dashboard to your account’s data. It’s free and anonymous – I’ll never know if you do it. I hope you gain insights when you use my work.
As you use analytics please reach out to me on Twitter and tell me of your success. Let’s do something awesome today!
You may enjoy my book if you learned from this article. It’s called Responsive Web Design Toolkit: Hammering Websites Into Shape. Get it on Amazon today!

-
Date Handling in JavaScript is Hard – Make It Easy With Moment.js
 Dealing with Time I have several web app projects that all deal with timestamps
-
Translated Strings and Foreign Language Support in JavaScript Web Apps
 Translated Strings and Foreign Language Support Foreign language support in JavaScript single-page web apps